
Key Takeaways
- Spatial transcriptomics retains location information that dissociation-based scRNA-seq loses.
- Sequencing-based and imaging-based platforms trade gene coverage against resolution.
- Applications include developmental biology, oncology, drug-response studies, and disease modeling.
- Sectioning quality and consistent imaging strongly affect spatial data from small organoids.
What Is Organoid Spatial Transcriptomics?
Spatial transcriptomics maps RNA transcripts and records where in the section each was detected. Most platforms were first developed for flat tissue sections. Organoids are small, three-dimensional structures, which makes embedding, orientation, and sectioning more demanding.
Brain organoids can form layered structures resembling neural tissue, and kidney organoids form tubule-like structures. Sections through these structures need careful orientation to be interpretable.
Why Spatial Context Matters
A 2023 study combined single-nucleus RNA sequencing with spatial transcriptomics to study brain organoid development (Cell Stem Cell, 2023). The authors reported that organoids with more complex morphology more closely resembled human fetal brain development. When architecture was disrupted:
- Cells became spatially and temporally intermixed.
- Developmental progression became aberrant.
- Cytoarchitecture and maturation timing shifted.
Matching expression profiles alone was not sufficient for normal development. Spatial organization also mattered.
Spatial Transcriptomics and Single-Cell RNA-Seq
Dissociation-based single-cell RNA sequencing profiles gene expression in individual recovered cells and helps identify cell types and states, but typically loses their original positions within the organoid.
Spatial transcriptomics measures RNA expression while retaining information about where that expression was detected in a tissue section. The spatial resolution varies by platform: some methods capture transcripts from regions containing multiple cells, while imaging-based approaches can detect individual RNA molecules and, with appropriate segmentation, support cell-resolved measurements.
Neither method is universally superior. scRNA-seq often provides rich expression profiles from individual cells, while spatial methods add anatomical context. Integrating the two can help researchers interpret cell populations in relation to the organoid's internal architecture.
Computational mapping of single-cell reference data onto spatial measurements can increase interpretability, but inferred cell locations or gene-expression profiles should not be confused with directly measured observations.
A typical organoid spatial workflow:
- Fix and embed the organoid to preserve structure.
- Section it into thin slices.
- Capture transcripts or hybridize probes at defined positions.
- Sequence or image the captured signal.
- Map the data back to the tissue image.

Techniques and Platforms
Sequencing-Based Spot Capture
Sequencing-based arrays capture transcripts on barcoded spots or bins. Earlier spot-based designs used spots tens of micrometers wide, so each spot combined several cells. Newer high-resolution arrays use much smaller bins. Capture efficiency and section quality still determine whether small organoids yield usable data.
Imaging-Based In Situ Methods
Methods such as MERFISH and seqFISH+ image individual RNA molecules in place. Compared with sequencing-based arrays, they typically offer:
- Higher resolution, down to single molecules.
- Targeted gene panels, often smaller than whole-transcriptome methods.
- Greater imaging and computational load per sample.
Multi-Organoid Profiling
High-density spatial transcriptomics platforms can profile multiple organoids on a single capture surface, potentially improving experimental throughput. However, the number of organoids placed on a chip does not necessarily equal the number that will produce analyzable spatial expression data.
A 2026 study by Nucera and colleagues in iScience systematically evaluated spatial transcriptomics across eight stem-cell-derived organoid models, including models of brain, heart, kidney, lung, cartilage, and hematopoietic tissues.
The researchers investigated whole-transcriptome spatial profiling across different organoid types, methods for placing multiple samples on the same chip, and limitations in RNA capture efficiency compared with reference tissues.
The study illustrates several practical considerations:
- Sample orientation: embedding and sectioning should preserve the structures needed for interpretation.
- Tissue attachment: sections must remain appropriately positioned and attached throughout the relevant preparation and molecular-capture steps.
- RNA capture efficiency: small tissue regions or low RNA recovery can reduce the amount of usable expression information.
- Chip utilization: multiple organoids can share a capture surface, but placement and usable tissue coverage must be planned.
- Regional interpretation: spatial measurements should be checked against tissue images and relevant quality-control metrics before comparing organoid structures.
Researchers should evaluate usable transcript counts, spatial coverage, tissue morphology, and sample-level quality-control results instead of relying only on nominal spatial resolution or the number of organoids loaded.
Computational Integration
Two computational tools map single-cell references onto spatial data:
- Tangram (Nature Methods) aligns scRNA-seq or snRNA-seq profiles to spatial locations.
- CytoSPACE (Nature Biotechnology) assigns individual reference cells to spatial coordinates.
These methods infer single-cell detail from reference data. Their outputs are estimates, not direct measurements.
Platform choice depends on cost, throughput, resolution, and gene coverage. A question about fine cellular boundaries needs different tools than a drug-response comparison across many organoids.
Applications
Developmental Biology
Spatial maps of gene expression over time are used to study tissue patterning and lineage specification. The brain organoid study above is one example, showing that developmental timing depended on correct spatial organization.
Oncology
Patient-derived tumor organoids can retain heterogeneity seen in the source tumor. Spatial profiling can reveal transcriptionally distinct regions within and between organoids that a bulk measurement would average.
Drug-Response Studies
Spatial data can show whether a compound affects all regions of an organoid equally. Regions that respond differently may point to distinct cell subpopulations.
Disease Modeling
Spatial maps help assess whether a disease model reproduces the architecture and signaling niches of the tissue it represents.
Common Challenges
- Resolution and cell density: larger spots combine signals from several cells, which blurs boundaries in densely packed organoids.
- Batch variability: freezing method, section thickness, and fixation affect RNA quality. A fixed standard operating procedure improves cross-batch comparisons.
- Cost and quality-control attrition: profiling many organoids or time points is costly, and some samples fail quality control.
Planning extra samples for failed runs helps protect study timelines.
Sample Preparation and Imaging
Section quality, tissue integrity, and imaging consistency influence spatial results before sequencing begins.
Isolating Regions of Interest
When a spatial transcriptomics experiment identifies a biologically interesting region, laser capture microdissection (LCM) can support follow-up molecular analysis by isolating a morphologically corresponding region from an appropriately prepared section.
If the follow-up collection uses an adjacent tissue section, the original spatial coordinates cannot be transferred automatically. Even consecutive sections of a small organoid may differ in orientation, shape, and cellular composition. Researchers should use histological landmarks, section orientation, and image registration where appropriate to identify corresponding structures.
The collected material can undergo a validated downstream molecular assay, such as qPCR or low-input sequencing. The resulting measurement represents the captured cells or region; LCM does not independently generate a new spatial transcriptomic map or preserve an expression profile for every cell in the original section.
A 2025 review of spatial transcriptomics alignment and integration discusses the challenges of registering and comparing molecular information across tissue sections.
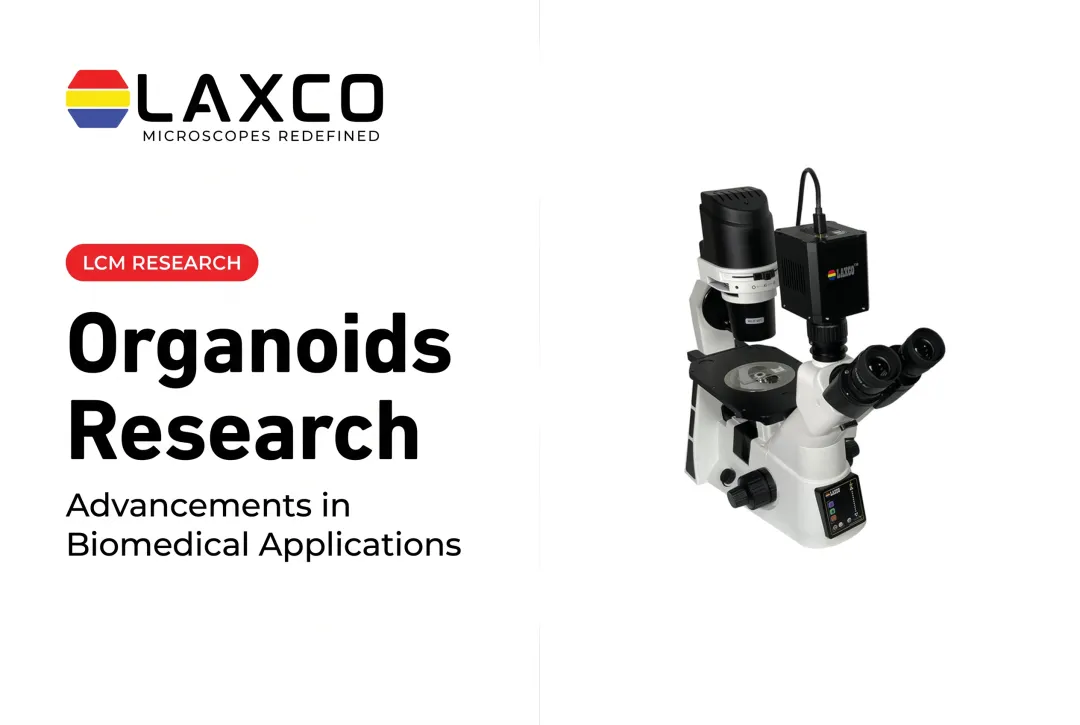
For this targeted sampling step, Laxco's Accuva Cellect Laser Capture Microdissection System provides:
- An infrared (IR) laser designed for film capture of single cells or small numbers of cells.
- An ultraviolet (UV) laser designed for cutting dense structures.
- A five-step software workflow with visual quality control and documentation.
- Documented support for FFPE and fresh-frozen samples, H&E-stained and LCM-optimized stains, immunofluorescence, unstained samples, and cell culture.
Consistent Imaging and Analysis
Laxco's LEAP AI pairs Accuva LEAP optics with Media Cybernetics Image-Pro AI. It follows an Image → Process → Measure → Report workflow. Pre-trained deep-learning models support AI-assisted segmentation, which can reduce variability between analysts once validated for the organoid type.
For live organoid cultures, Laxco's CellLive systems support scheduled time-lapse imaging inside CO₂ incubators before fixation.
Future Directions
- Resolution: chemistry and imaging advances are moving platforms toward routine single-cell resolution.
- Standardization: community proposals call for sharing raw images, metadata, segmentation masks, and count matrices.
- Organoid metadata: recording passage number, culture conditions, and treatment would improve comparability between labs.
The Cellect Grant Assistance Program provides Grant Language Kits for NIH, NSF, HHMI, and DOD proposals that include LCM.
Frequently Asked Questions
Can spatial transcriptomics reach single-cell resolution in organoids?
Resolution depends on the platform. Imaging-based methods can detect individual molecules, and high-resolution arrays use small bins. Computational tools such as Tangram and CytoSPACE add inferred single-cell detail using reference data.
Which organoid types are used in spatial studies?
Published spatial studies include brain, heart, kidney, lung, intestinal, cartilage, and tumor organoids. Multi-organoid studies sometimes profile several types on the same array.
How does LCM complement spatial transcriptomics in organoid research?
LCM can isolate selected regions from prepared organoid sections for additional molecular analysis. When sampling a region identified on a spatial transcriptomics map, researchers should use morphological landmarks and appropriate image alignment to locate the corresponding region, particularly if collection occurs from an adjacent section.
The collected material can then undergo qPCR, low-input RNA sequencing, or another compatible downstream assay. These measurements can support follow-up investigation of spatial findings, but the results reflect the collected region and do not automatically reproduce the original map's spatial resolution.
Which sample types does Accuva Cellect support?
Laxco lists FFPE and fresh-frozen tissue, H&E-stained and LCM-optimized stained sections, immunofluorescence, unstained samples, and cell culture. Organoids are typically fixed or frozen and sectioned before microdissection.